I’ve been chasing my tail through dozens of out of date, obsolete, and partially correct instructions on getting a pyCharm debugger setup with Maya. I’ve encountered issues with MayaPy 2017 no being recognized by pyCharm as a proper python interpreter. I also have access to Maya 2015 and don’t mind doing development on that.
I’ve used pyCharm for remote debugging in the past on different machines and generally what’s happened for me is that it takes me a week to get all the bits and pieces doing what I want, I use it for two weeks and then I’m off on other tasks long enough for my setup to decay and I’m back to fixing it up again.
I’m somewhat deperate at this point to get any combination of IDE with autocomplete and remote debugging working. Does anyone have any resources to recommend to go through setup such that I can step through pymel code?
Think i can help you out a little, i make pretty heavy use of PyCharm and Maya and have written my own integrations with the debugger and Maya. I never tried this on 2017 my the method i use has been working since Maya 2012 and i’m on 2016 atm.
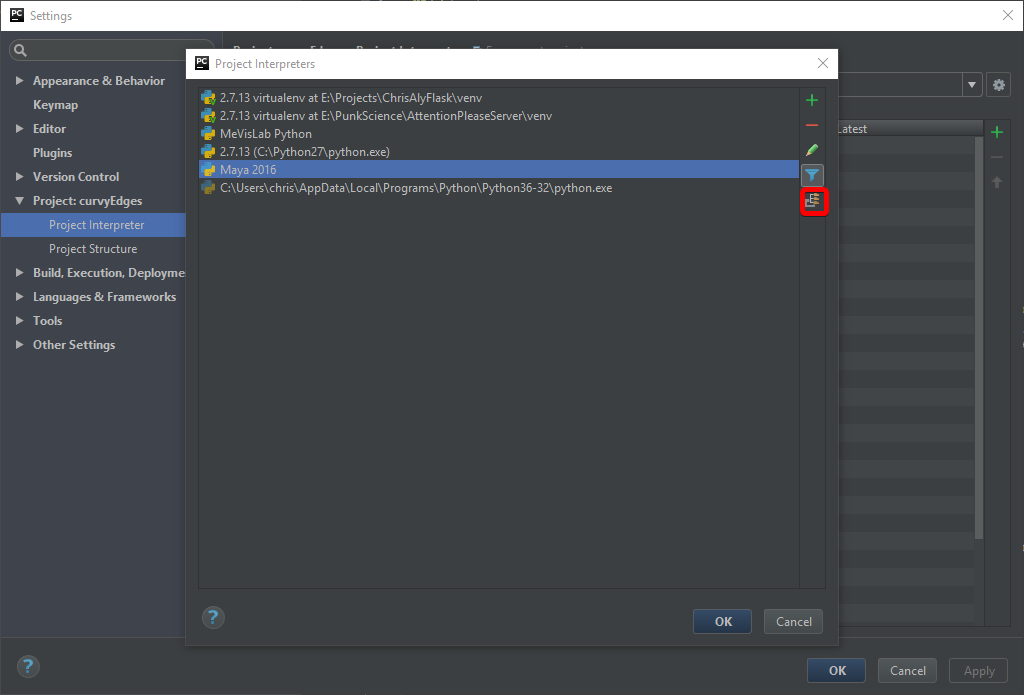
Open PyCharm and Navigate to Settings>Project>Project Interpreter
in the drop down for the interpreter select Show All create a new Local Interpreter and point it to mayapy.exe in your Maya’s bin folder.
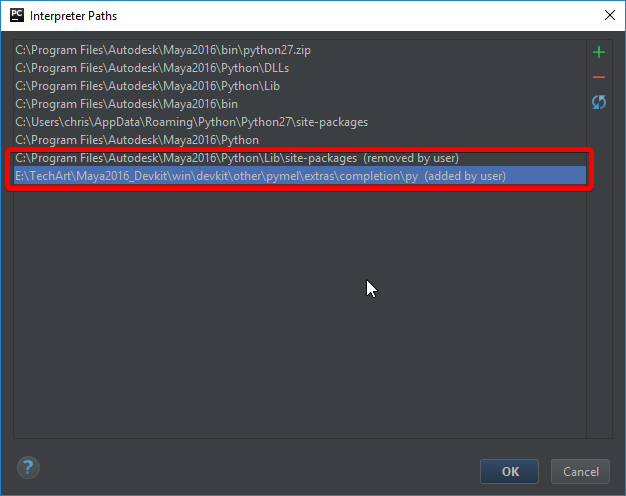
After this we need to add and remove some extra things to the PATH of that interpreter.
Select this entry to change the paths on the Interpreter, first we want to remove the site pacakges folder, than we want to add a new path that points to the devkt/other/pymel/extras/completion/py folder of the devkit we downloaded earlier.
After this we are done, just hit OK and apply changes and make sure when ever you are working on Maya scripts you are using this new interpreter and it will AutoComplete.
Remote Debugging via MayaCharm (PyCharm Professorial Only)
In my opinion the easiest way to get this working is via a PyCharm Plugin i wrote.
got into Settings>Plugins and Select Browse Repositories and search for maya and Install MayaCharm
Select a new port if hte default conflicts with anything and than paste the resulting code snippet to Maya’s userSetup.py
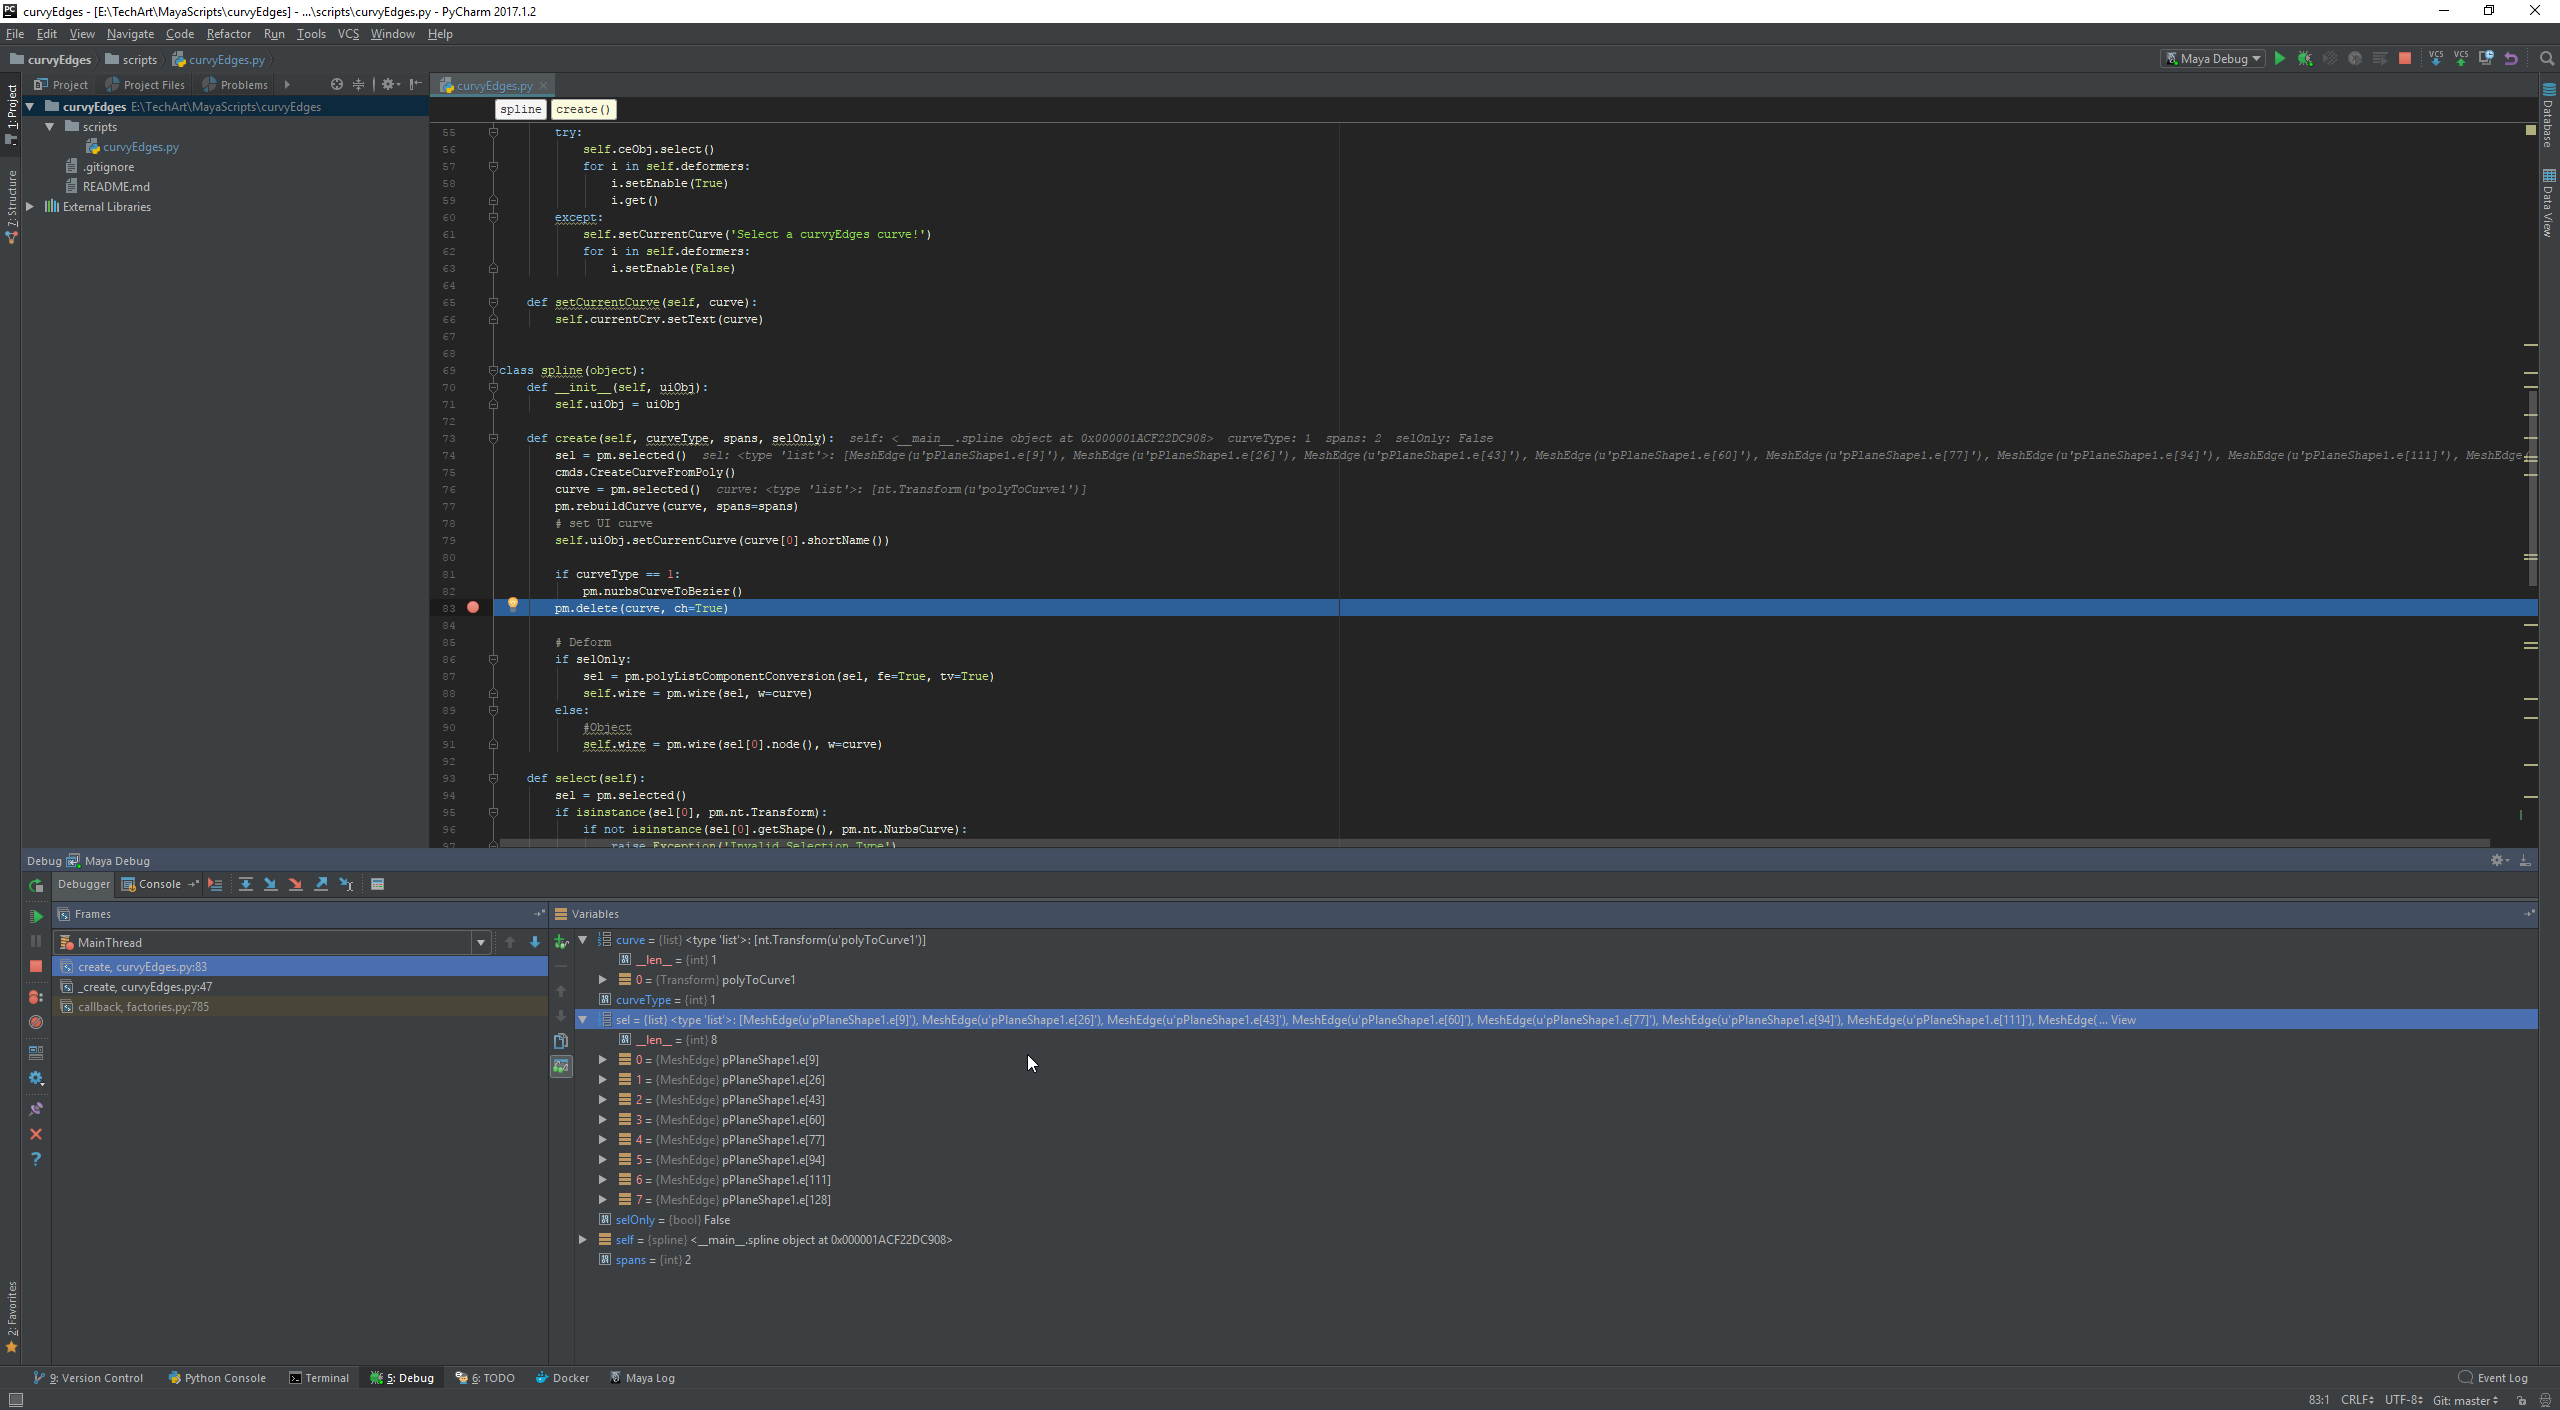
After this you are all setup, all you need to do next and create a Run/Debug Configuration, provide the file or code to execute in Maya on run, set some breakpoints and start the debugger.
Oh i forgot one small detail, some of the completion stubs for Maya have a greater filesize than what PyCharm wants to read by default. You can get around this by going to PyCharms bin folder and locating the idea.properties file. In this file locate the property idea.max.intellisense.filesize and give it a higher value, i tend to give it 64mb and have never had problems. idea.max.intellisense.filesize=64000
What version of PyCharm are you using? Setting interpreters has always been wonky in PyCharm and it is one of my main complaints with the IDE. It’s easy to setup, but incredibly buggy if you decide to rename or change folders. Sometimes simply renaming the interpreter profile name fixes issues after adding removing paths to the interpreter libraries, but I’ve had to wipe my user profile and reinstall to fix issues…
I recommend using MayaCharm if you intend to use PyCharm with Maya exclusively.
We needed a solution that was DCC agnostic. Something to note is that if you intend to use its trace routine remotely, you need to add the pydevd module to your project libraries or manually import the pydevd module included with PyCharm for any script/tool you’d like to debug (or at least this is how I got things to work for me).
At some point I had multiple versions of PyCharm so I needed to fetch the latest. I included the script below. There are custom methods to handle the registry in the below snippet, but hopefully you get the idea. Import and call pycharm_settrace() in the script/tool you want to debug and make sure you run the PyCharm debugger with the correct host and port values before executing the script.
import sys
import os
from libs.utils.registry import get_registry_value, list_sub_keys


def pycharm_init():
    """
    Retrieves PyCharm installation from registry and adds pydev module to sys.path.
    """
    PYCHARM_PATH = ''
    key_path = 'HKEY_LOCAL_MACHINE\SOFTWARE\Wow6432Node\JetBrains\PyCharm'
    for sub_key_name in list_sub_keys(key_path):
        PYCHARM_PATH = get_registry_value(os.path.join(key_path, sub_key_name))
        print 'PyCharm installation found: {}'.format(PYCHARM_PATH)

    # ex. PYCHARM_PATH = 'C:\Program Files (x86)\JetBrains\PyCharm 4.0.3'
    if os.path.exists(PYCHARM_PATH):
        pydev_path = os.path.join(PYCHARM_PATH, 'helpers\pydev')
        if os.path.exists(pydev_path):
            if not pydev_path in sys.path:
                sys.path.append(pydev_path)


def pycharm_settrace(host='localhost', port=7720, suspend=False):
    """
    Sets trace for remote debugging from an application running python.
    """
    pycharm_init()
    try:
        import pydevd
        pydevd.settrace(host, port=port, suspend=suspend)
        print 'PyCharm debug trace enabled.'
    except ImportError as e:
        print e
        print 'PyCharm debug trace disabled.'
Wow guys this looks great. All of these steps looks familiar - from what I’ve been trying to piece together from across different articles and posts on the net. Re:2017 pyCharm - I was afraid of update my pycharm from ~ 6 months ago and the 2016 version couldn’t recognize the 2017 mayapy.exe as a valid python interpretter.
With renewed energy from your posts, I updated pycharm this morning and it appears to accept the 2017 mayapy.
I wiped my settings, and besides some lingering environment variables I should have a relatively fresh environment, I’ll try to take notes as I go along to share back. In particular the weaknesses in other resources I’ve been trying to follow are 1) frequent UI updates and relabeling of settings in pycharm 2) Error messages for connection error failures have limited information and instructions mostly cover the happy path. Consolidating generic warning into a troubleshooting guide would be immensely helpful and I’ll try to lay some groundwork there as I’m experienced enough to want this, but not experienced enough to do things correctly the first … half dozen times.
yeah some of the biggest issues i have had are with the path the to pydevd debug egg file being changed everytime pycharm even gets a minor update. That is the reason why i made Mayacharm, reset the path to it on every run. But this issue hits pretty much anything that uses the remote debugger and not just Maya.
I was really optimistic about MayaCharm being the easy mode - but the GitHub readme was so short when it didn’t work I didn’t know what else to try. I realize it’s supposed to be my job to know how to debug through issues like this but I have more breadth than depth, and unless I have to do something more often than every 6 months I find I have to reteach myself the basics rather than improve my ability to catch the gotchas.
Okay I have updates! I have successfully hit a breakpoint from Maya using the debugger! Huzzah!
After going through that step by step it functioned in a fairly straight forward manner so I honestly don’t have a great explanation as to what the hold up was before.
A few notes I do have:
Install Plug In NOTE - if you do not see Maya in the list you are searching in you are likely currently browsing installed plug-ins and did not select browse repositories
Looking at the GitHub Readme - all the topics covered here are generally covered in the readme - but for those not already really comfortable the steps are combined, for instance the first sections reads:
It requires some minimal setup. The settings panel is in “Settings > Other Settings > MayaCharm” just define your port number or leave the default and be sure to copy and paste the code it generates into Maya’s userSetup.py
I would adjust to:
Go to Settings > Plugins, and Select Browse Repositories and search for “Maya” Install MayaCharm using the Install Button.
Go to Settings > Other Settings > MayaCharm and copy and paste the code it generates into Maya’s userSetup.py
If you have port conflicts select a new port and then adjust the resulting code snippet to Maya’s userSetup.py again.
The information is all there, but separating it helped me make sure each step was isolated and the cause/effect is more closely tied. I think I spend a lot of time conflating debugg/egg and auto-complete set-up when trying to piece it together and you’ve drawn the line in your breakdown between autocomplete relevant and debugger.
Now I’m just left wanting more explanation on the Run vs. debugger and which of the settings on the Debug config screen matter. If you would indulge a few more questions!
I’ve seen screenshots with single-instance both checked and unchecked. When using MayaCharm what is recommended and why.
I’d like to understand the difference between file vs. code drop down. In previous implementations I could launch debug with any file open to begin debugging. Is that not true with MayaCharm? If I was debugging multiple files often should I be creating extra debugger configurations?
Can I have an example use case for the Code: section?
Reflect output to console refers to seeing Maya output in pycharm correct?
Why should/should not one use suspend after connect?
The GitHub Usage section says:
If using Community Edition just setup the MayaCharm Runner run Configuration than it will work just like a normal python run configuration. If using Professional Edition you can use the MayaCharm debugger instead which can be used as a runner or debugger. There is also a Execute Selection and a Execute Documeant actions in the run menu, that can also be accessed via alt+s and alt+a
And then finally, what is the use case for MayaCharmRun? While I got debug working by running it with the script I wanted specified and then running that script from Maya - what can I expect from Run? I suspect I may have even had a functioning setup but I was expecting the debugger or run to launch the script for me.
When do run debug I often get what seems to be a breakpoint on a temp file “MayaCharmTemp7456871900026612754.py” and my code doesn’t execute.
So a short HelloWorld! that manages my expectations would help - as the Run doesn’t appear to do anything for me and debugger only works if I launch the code from Maya myself. That doesn’t sound like what’s described. Also Alt+A and Alt+S aren’t doing anything for me - and I cannot tell what I’m doing wrong.
Thank you for replying again, this has been immensely useful.
Sorry about taking so long to reply, its been a busy week.
Well first of all thanks for spending some time to talk about usability, and i am open to make changes to the plugin on the on-boarding process of it.
Yeah i am going to make these changes as per suggestion next time i make changes in the repo.
I never addressed this because it is a PyCharm thing not a feature of my plugin. All it does it change the behavior the run and debug buttons for this configuration in PyCharm. If Single Instance Only is not checked every time you hit the debug button, it starts a new debugger, instead of restarting a already existing one.
This simply just lets you provide some a file or some code that MayaCharm will execute in Maya after the debugger is fully attached. I often write my scripts with a
if __name__ == "__main__":
    my_func()
like statement at the end which allows them to be executed by either executing the whole python file, or via importing and running the appropriate function. So the file option lets you define a file to run after the debugger is attached, and the code one lets you define how to import and run your code if you prefer to do it that way. I am actually adding a 3rd option on the next build which will only attach the debugger and take no further action.
Correct, and it is a option of the python remote debugger its self not this plugin.
These are one and the same, when suspend after connect is set, it is the same as hitting a breakpoint on the very first line of code executed after attaching the debugger. In the case of this plugin that first line is actually in the temp file i use to pass code to Maya. I personally do not use this option but i guess it could be useful for those that
want to suspend there script immediately and step through all lines of code instead of strategically placing breakpoints.
If you have PyCharm Pro there is no use vsdr at all for the Runner, since everything it does the Debugger can do as well.
Alt+A and Alt+S are just tied to the Execute Document and Execute Selection in Maya actions, these same actions exist in the Run menu and can be rebound.
Yes the intent is that when you setup a debugger, it will attach the debugger and automatically run the code or file you defined, and that the Execute Document in Maya and Execute Selection in Maya actions are meant for executing code in PyCharm in maya via the command port.
For any of this to work, you do need the plugin properly configured and you do need the code snippet MayaCharm gives in Maya and run so there is a open CommandPort i can use to communicate with Maya, but if the debugger is properly attaching without you manually called settrace in maya that means the commandPort is open.
if you are still having issues i could try and screencap my process from scratch, install to having it working and hitting breakpoints on a script, but this thread has been pretty exhaustive and has led me to some good changes i will make for the future.
edit:
Thinking it would be great for the community to take all of these info at some-point in the future and make a proper pdf outlining in detail the whole process, or simply adding more of it to my readme.md.
Thank you so much this was all so incredibly helpful! I typed up a reply and must have not sent it but I wanted to let you know I’m already quite and making good use of the break points and your help is so much appreciated. If you have any interest in working on broader beginners guide post here some more. As I’m going I’m trying to stay aware of things that would be easy to explain and would help people starting out.
Glad it is helping people, at some point i do want to make a proper guide, and i also want to see how far i can take the automation of all of these setup with my plugin, but that is a long term goal, since i am pretty busy as of late.
in recent versions of PyCharm the debugger is a little more finicky, but as long as your interpreters are setup correctly you should be able to attach the debugger from the community addition